
Motivated by an expected decrease in installed power on future vessels, MARIN, supported by the Dutch Ministry of Infrastructure and Water Management, developed tools to describe the handling of a low-powered ship in adverse weather. Recently, these tools were used to investigate their safety in extreme conditions.
In the near future, the expected increasing impact of the weather on operational performance in terms of sustained speed, reliability in terms of arrival time and energy expenditure will be addressed. The developments aim at a rational, first-principles assessment of the relation between installed power and safety, economy and energy expenditure.
The first step in the investigation, which focused on safety, assumed, rather simplistically, that a timely recovery of a head-seas course might serve as a criterion for the minimum power to be installed in a ship. This problem was investigated by simulating head-seas recovery manoeuvres in wind and waves for the full block ships that are common in the Dutch fleet.
In the second step, the very nature of the unacceptable behaviour associated with a too low power was explored, together with an investigation into the factors that govern its risk of occurrence. In addition to the added resistance and course keeping, this stage paid attention to the frequency of the joint statistics of wind and waves in relevant sea areas and the impact of propeller ventilation and engine characteristics on the available propeller thrust.
Tools
A reliable prediction of the added resistance and wave drift forces is crucial in the assessment of the handling and speed of a ship labouring in waves. The progress made in the development of the Rankine source code FATIMA, as described in an earlier article (published in SWZ|Maritime’s January issue and on our website), was essential in this respect.
Because of the large changes in speed and heading during a manoeuvre and the presence of several non-linear elements in the excitation and reaction forces, its description requires a time-domain simulation. This tool, the MANWAV script (in MATLAB), was developed and validated in cooperation with the MANWAV Working Group in the MARIN Cooperative Research Ships.
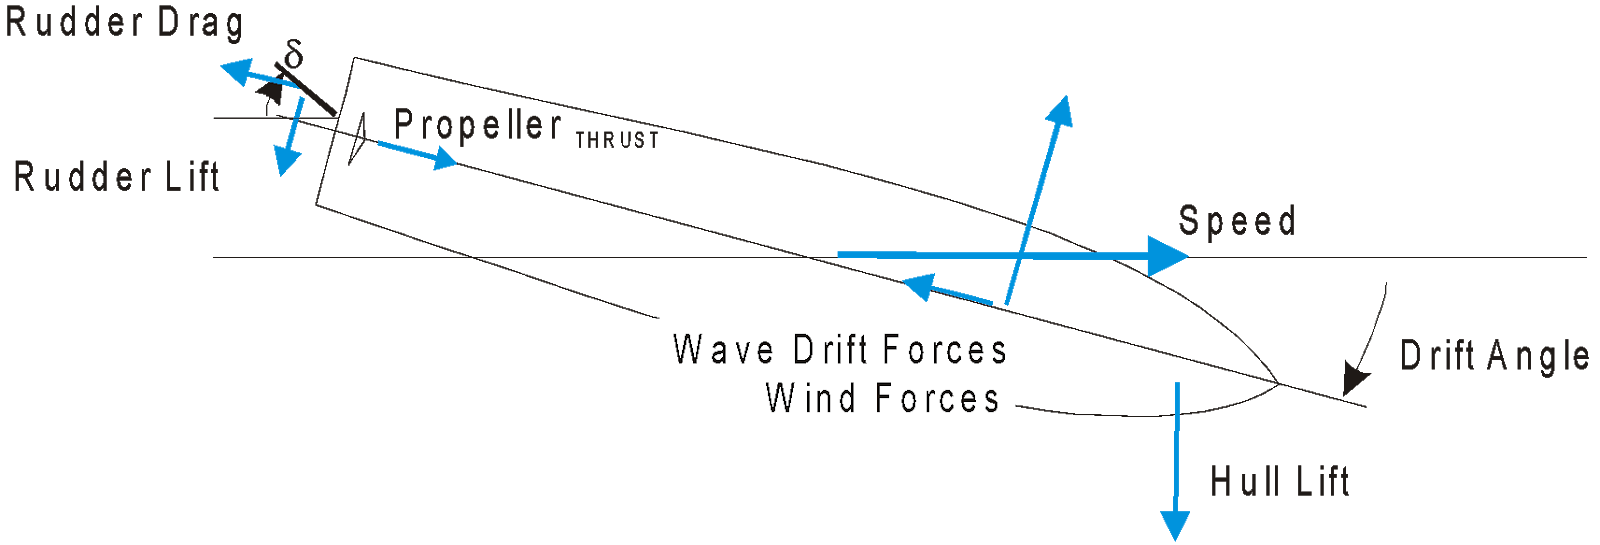
Figure 1. MANWAV simulation element.
The preparations for a set of simulations comprise the generation of a number of databases describing:
- The added resistance and the transverse drift forces in regular waves for a range of speeds and headings (in terms of the quadratic transfer functions).
- The wind forces as a function of relative speed and direction.
- The resistance and the manoeuvring reaction forces experienced by the hull as a function of speed, drift angle and rate of turn.
- The rudder forces as a function of propeller thrust and helm angle.
- The available propeller thrust as function of ship speed and propeller and engine characteristics.
The simulation itself uses the above databases to calculate the time, position, speed and heading dependent on external forces and the hull and rudder reaction forces that govern the behaviour at that point in time. From a computational point of view, the accurate synthesis of the instantaneous value of the added resistance and transverse wave drift forces is a major time-consuming element.
MANWAV limits itself to the “low-frequency“ speed variations and course keeping. The effects of individual waves, like the instantaneous propeller loading and submergence can be accounted for. As a function of the prevailing position, speed and heading, they are evaluated on the basis of the frequency-domain results that underlie the calculation of the added resistance and wave drift forces.
Of course, the simulation needs input regarding the target manoeuvre, whether being straightforward track- or heading-keeping at a given power level or a more complicated head-seas recovery procedure.
Head-seas recovery procedure
In preparation for the simulations, the added resistance was calculated for a number of full block hull forms. The substantial differences between these hulls were used to select four hulls. The simulations comprised a considerable number of “runs” in which a head-seas recovery manoeuvre was executed at random points in time, all starting in beam seas. Each attempt was simulated for five minutes.
The adopted combinations of wind, wave height and wave period were based on the analysis of wind and wave data along the Dutch coast. Extremes with a return periods of one month and one and ten years were considered.
In the initial stages of the work, it was realised quite soon that it is not the available power, but the available propeller thrust that drives the sustained speed and is required to force the bow towards head seas. This level was captured in the Effective Bollard Pull (EBP). It is governed by the propeller (see figure 2) and the engine characteristics.
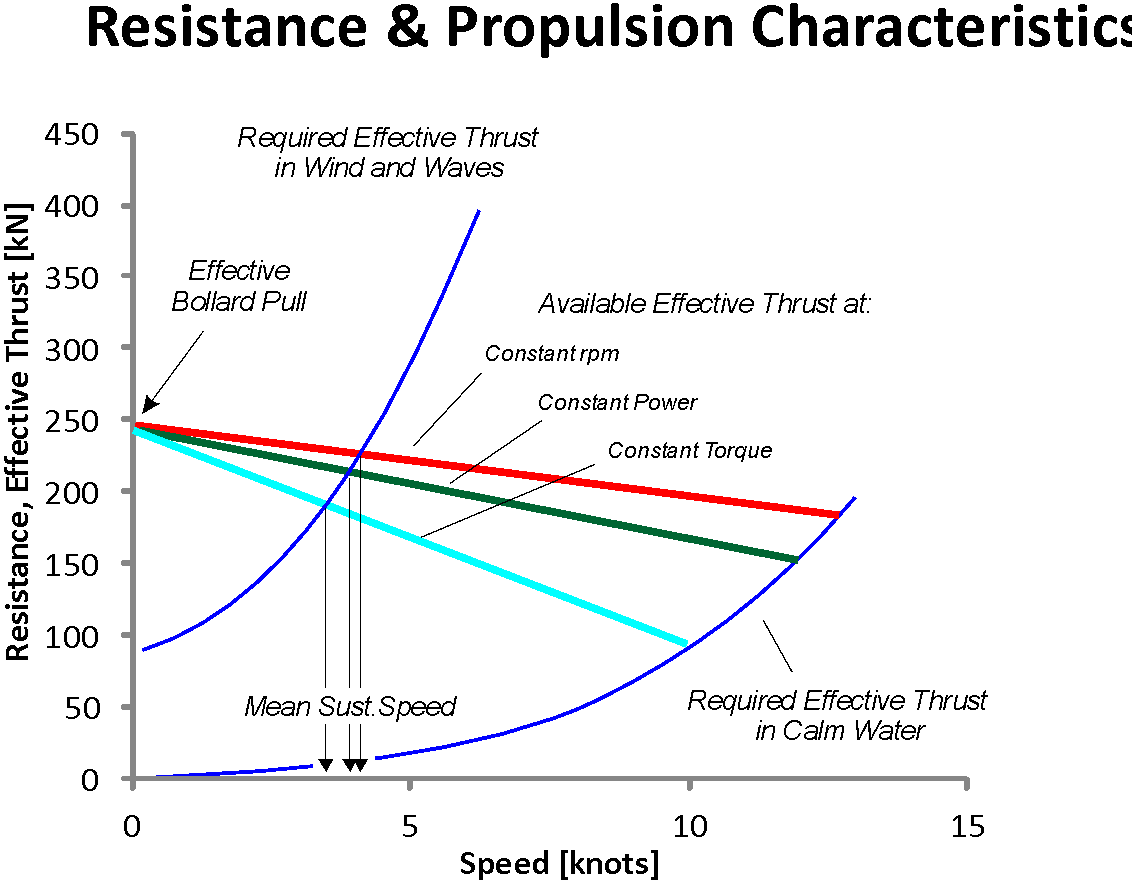
Figure 2. Balance of available and required thrust.
Figure 3 shows an example of the failure rate as a function of the EBP and the return period of the wave condition. The minimum required EBP was based on the assumption that on average out of three attempts, one will yield a successful manoeuvre. The obtained EBPs were given an interpretation by Conoship, which assessed the propulsion power installed in a broad range of existing ships and the expected remaining power under the EEDI.
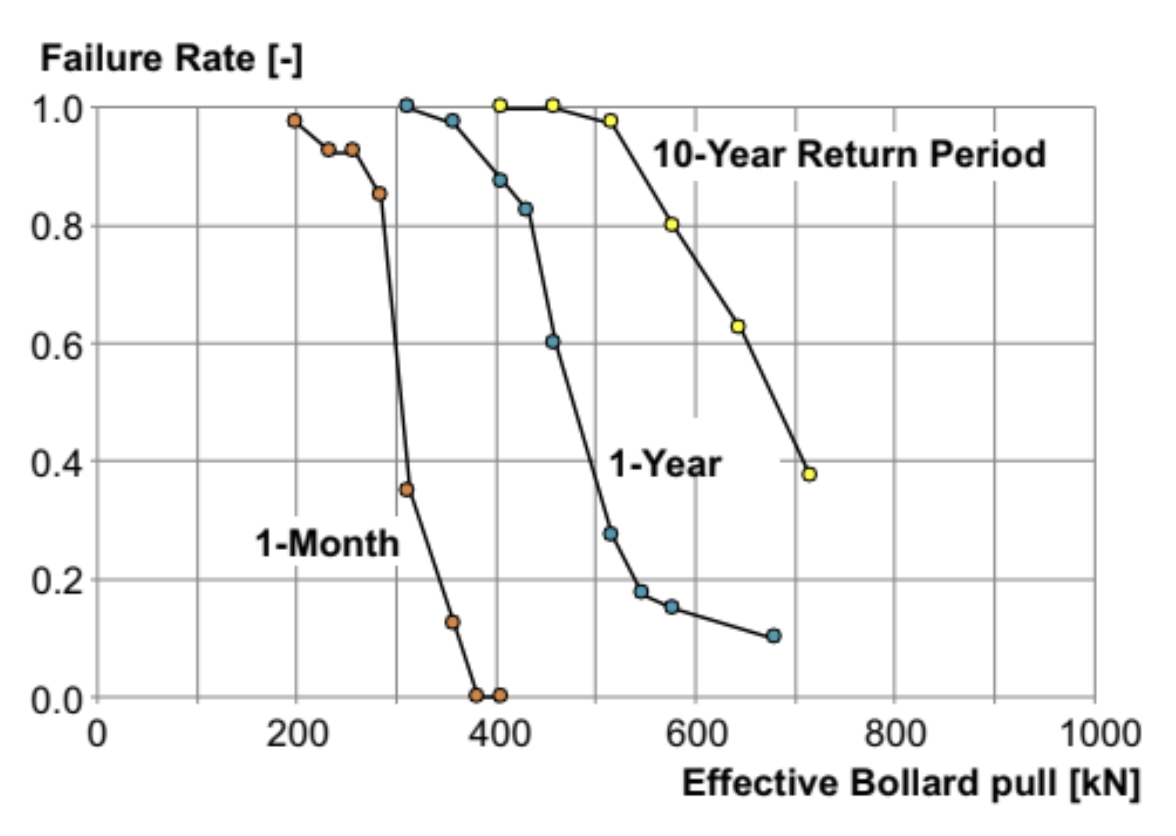
Figure 3. Failure rate versus Effective Bollard Pull.
The basic conclusion from the first step was that the minimum power requirements were quite low in comparison with the expected future levels of installed power. At the time, it seemed that the main reason for this result was that in an irregular wave train there are many “windows” in which the waves are sufficiently low to complete the turn.
Nature of minimum power requirements and driving factors
In the first step of the investigation, relatively crude assumptions were made in several areas. In addition, we became increasingly aware of the potential impact of the static engine rpm-power characteristics on the available propeller thrust in the case of a directly driven propeller.
Puzzled by the unexpected results in the first step and convinced that there should be something like a minimum power requirement, it was decided to explore the impact of these factors on course and track keeping. For practical reasons, the case adopted now for this investigation was the 229-metre KCS container ship on a full load draft. The KCS container ship is a publicly well documented vessel used within many studies.
Loss of control
With an adaptation to the simulation code to accommodate temporary negative speed, the new simulations did show an obvious criterion for minimum power: an uncontrolled loss of the safe head seas orientation. Because the transverse “lift” of the hull at a drift angle drives the ability to recover a course, a minimum speed is required. In addition, because the magnitude of this minimum speed was expected to depend on the level of transverse agitation, the effects of a directional spread in the waves as well as the wind were investigated. These simulations suggested a relatively small effect of these parameters.
The subsequent analysis made us understand that the main reason for the relatively low power requirements is that the added resistance is almost proportional to the forward speed, more so than the resistance from the wind. The low magnitude of the remaining added resistance makes it relatively easy to maintain a low speed.
Effect of heading
At first glance, sailing a track at an oblique direction with respect to wind and waves seems quite demanding because of the quite large excitation from the transverse yaw moment. Simulations in these conditions showed that the rapidly increasing drift angle with reducing speed (that is required to stay on track) reduces the yaw drift moment; at very low sustained speed, the vessel is more or less traversing along the track (see figure 4).
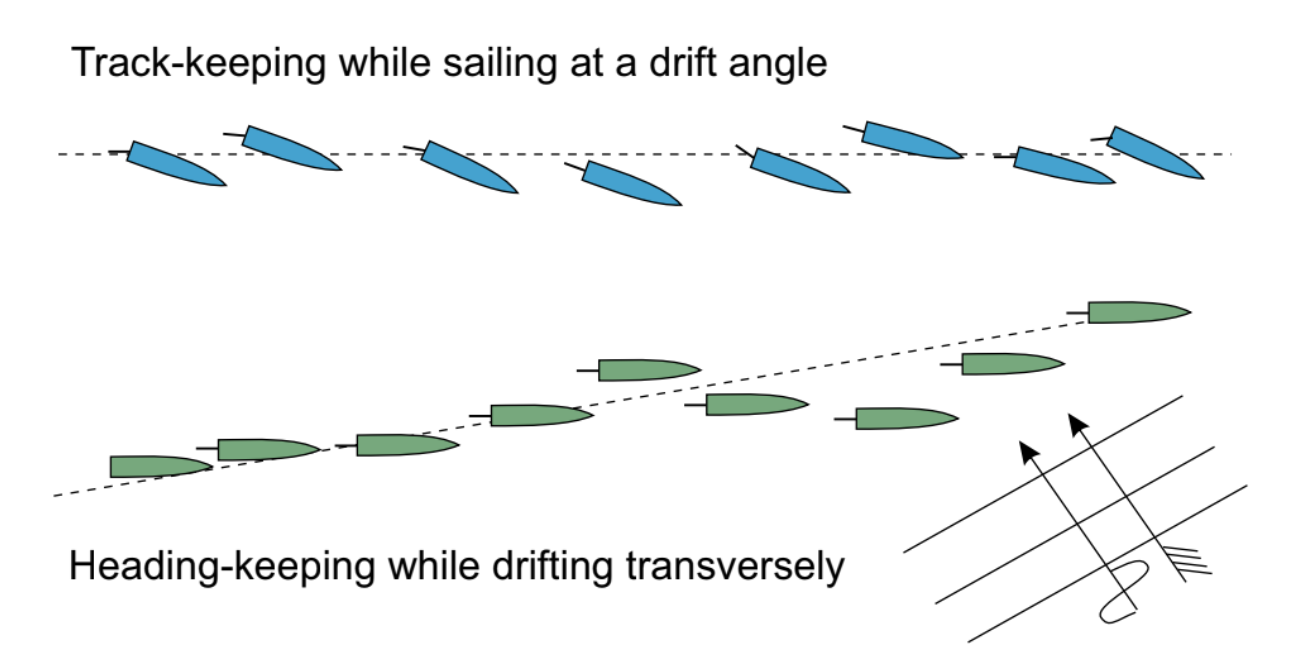
Figure 4. Heading- and track-keeping strategies.
Maintaining a heading in oblique waves, while drifting transversely, proves a much larger challenge. Both types of manoeuvres have their limitations in restricted waters and suggest a decent minimum speed to maintain track and/or a nautically acceptable drift angle.
Propeller ventilation
In 2018, MARIN performed a systematic set of experiments in which a propeller was oscillated in three directions just below the water surface. The Hexapod set-up is shown in figure 5. The results showed that when the propeller tip approaches a point at one-third of the radius below the surface, the first effect is the ventilation of the tip vortex.
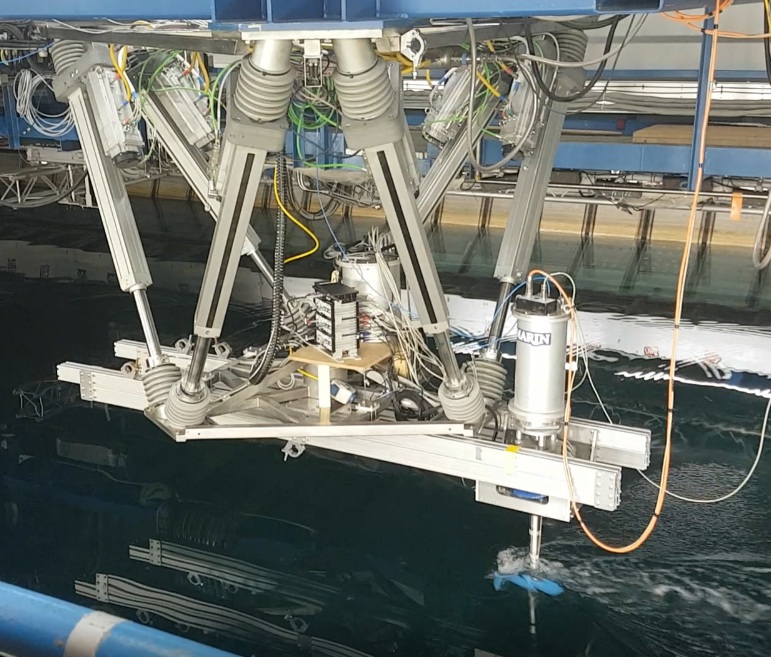
Figure 5. Forced oscillation set-up.
In higher propeller revolution rates this gives rise to erratic thrust and torque variations, “oscillating” between the fully ventilated and non-ventilated levels, see figure 6.
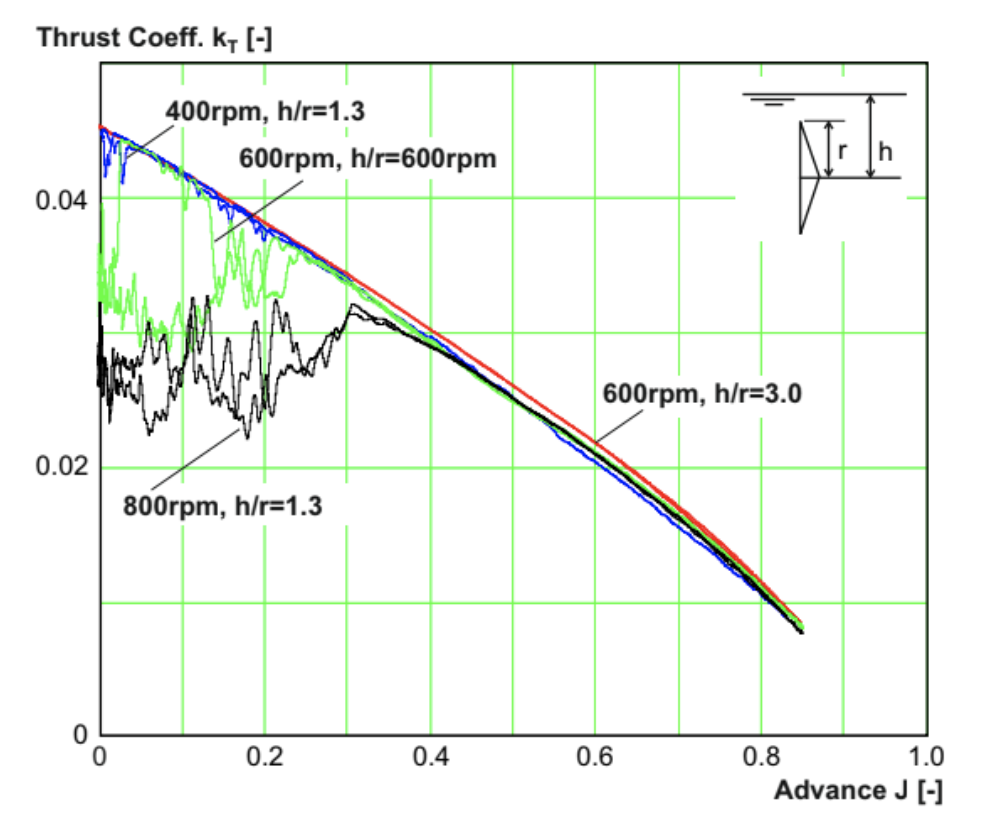
Figure 6. Thrust variation during a quasi-steady open water test at h/r=1.3.
As soon as the propeller tip emerges from the water surface, the thrust and torque become steadier in character. A complicating factor is that the drop in thrust and torque depend, through the propeller loading, quite strongly on the rpm. A remarkable observation is that the efficiency of the propeller, in terms of the thrust per unit torque, is quite insensitive to ventilation.
The results of the tests were modelled schematically in the MANWAV script to obtain an impression of the effects on the available thrust. These simulations indicate that, in the subject case, because the ventilation is rather incidental, the effects on the mean available thrust and sustained speed is quite small. Of course, this is not necessarily true for a ship in partly loaded condition. The results do suggest that, if any, the effect of ventilation materialises more through the dynamic response of the diesel engine on the torque variations.
Engine characteristics
In the case of a loss of speed, the torque requested by a fixed pitch propeller increases. Because a diesel engine is essentially a constant torque machine, this leads to a loss of revolution rate. If this loss crosses a particular threshold, the turbo-charger cannot supply an adequate air supply anymore. In this range, the related increased wear and tear is kept at bay by reducing the fuel injection, which leads to a further reduction in the available torque and thrust.
Connecting the engine characteristics and the thrust balance was one of more challenging tasks in the work. Not only conceptually, but also practically; the exact limits of the engines at reduced rpm were not as clear cut as hoped.
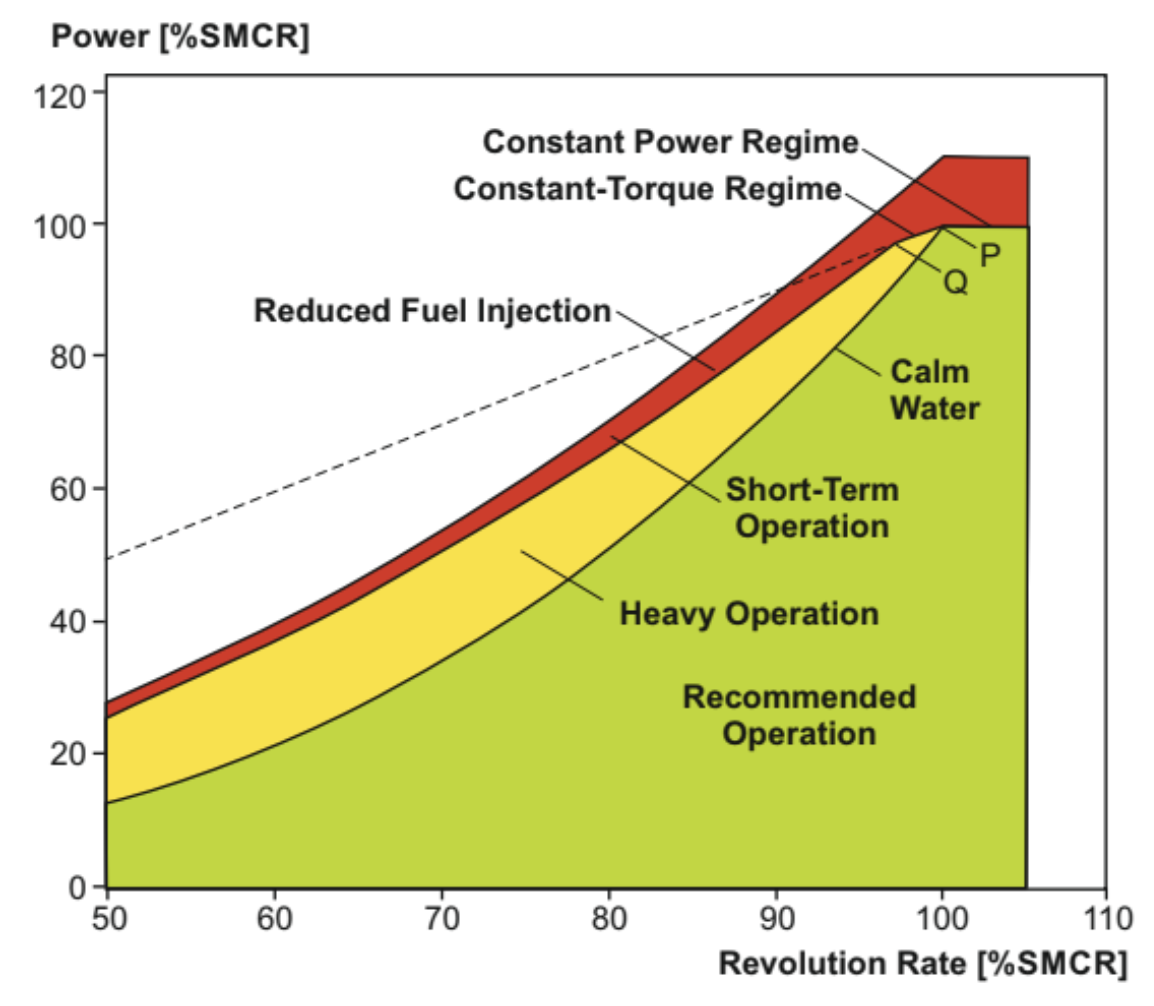
Figure 7. Typical static engine characteristics.
Figure 7 indicates the engine regimes at normal operation. The boundary between “heavy operation” and “short-term operation” is the limit at which the fuel injection is reduced.
Figure 8 shows the impact of the engine limits on the balance of the required and available effective thrust. In this case, the adopted power corresponds with a speed in calm water of eighteen knots. In Beaufort eight the intersection of the available and required thrust indicates a sustained speed of just over ten knots.
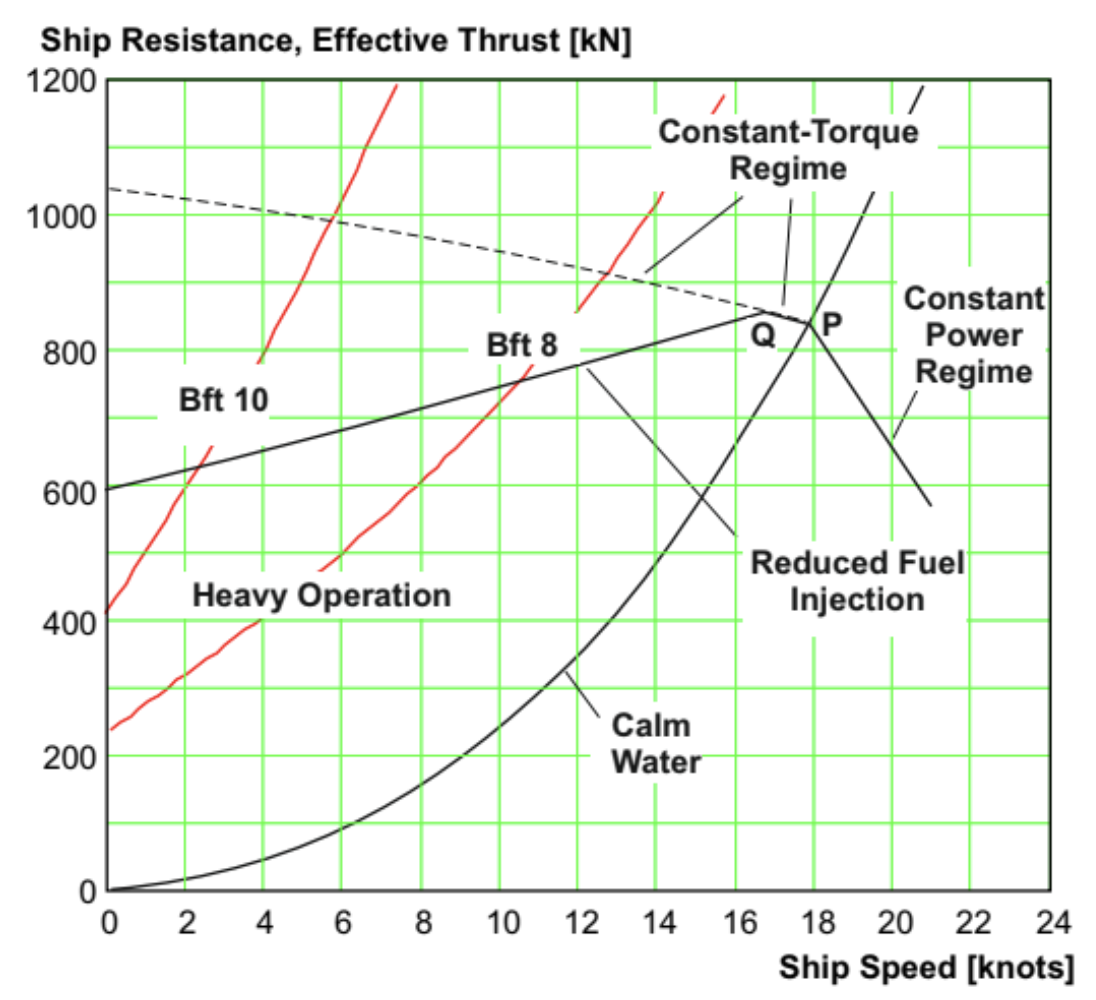
Figure 8. Impact of engine limits on the available thrust.
In this condition, and even more in the Beaufort 10 condition, the available thrust is governed by the above mentioned “smoke limit” of the engine. Because this limit itself and its consequences depend on details of the engine (level of turbo-charging, fuel type) and the engine-propeller matching (the light-running margin), these “details” are obviously important in the assessment of safety and performance.
Conclusions
The main conclusion from the second step in the investigation is that there is a minimum power requirement to enable a stable head seas course in extreme conditions, however the related power level is actually quite low. The fact that the added resistance in waves becomes quite small at low speed and that the magnitude of the wind resistance is limited explains this result.
A second conclusion is that the static engine characteristics have a large effect on the available torque and thrust. We also conclude that, because we know yet very little of the dynamic response to the propeller torque variations induced by wave agitation and ventilation, the related impact on the sustained speed is largely unknown.
Making use of a recent set of experiments it seems clear that in the present case (a container ship on the full load draft), the direct effects of ventilation are limited. Because the added resistance on reduced draft is not necessarily smaller than on the full load draft, because the wind forces increase and because the propeller gets closer to the free surface, this is not necessarily the case for ships on a partly loaded draft.
What is next on EEDI & MPR?
This article started with an expected decrease in installed power following the urgent quest for the reduction of greenhouse gas (GHG) emissions. Three future pathways are now possible around this GHG reduction:
- A further reduction of installed power following the EEDI phase 4 or
- A switch to a yearly fossil energy cap (read GHG emission budget) per ship type/size. The energy budget to be checked using the EU Monitoring Reporting and Verification data or
- An obligated percentage of renewable fuel to be blended. The percentage increases over time. Within automotive, the Renewable Energy Directive (RED II) requires up to fourteen per cent of renewable energy to be used.
The second pathway is perhaps the only option to meet the stringent IMO ambitions. This GHG cap pathway also reduces installed power in order to save energy, although now with the possibility to avoid critical low levels of installed power. As the power installed is not limited by the EEDI regulation anymore, but only by the available GHG emission budget.
Next to and following these power reductions, this pathway will apply renewable fuels and/or introduce new propulsion concepts to further lower GHG emissions and maintain competitiveness.
Now this combined introduction of a GHG budget, lower installed power and further down the road, new fuels urges a more detailed assessment of ships’ actual operations. This assessment includes, next to the added resistance in waves, the engine modelling as well. This in order to properly balance GHG consumption and voyage scheduling and to account for the envisaged effects of the new fuels on (engine) performance flexibility.
Further, with reduced installed power levels, the ability of ships to avoid adverse weather becomes smaller. Hence the impact of the weather on the sustained speed and reliability of the ship’s schedule keeping becomes larger. This stresses the need for a more rational design of the service margin; a process in which experience from the past may not offer a reliable guidance. Still, minimum power requirements will stay relevant for the very low installed powers or for example for the wind assisted vessels.
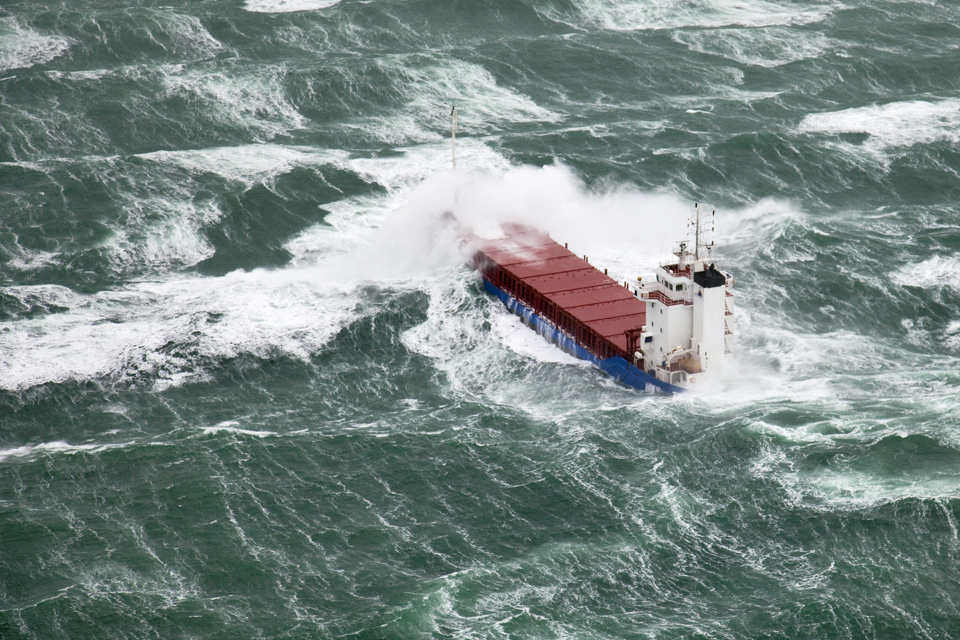
Picture (top): MARIN investigated the safety and performance of low-powered ships in adverse weather conditions (by Flying Focus).
This article was kindly supplied to SWZ|Maritime by MARIN and published in our February 2020 issue. It was written by: