On 13 April 2018, the IMO adopted resolution MEPC.304(72). This resolution reflects the IMO ambition to have shipping contribute to the reduction of greenhouse gas emissions. What does this mean for the individual ship’s emission reduction? And will it hit the target? Likely not.
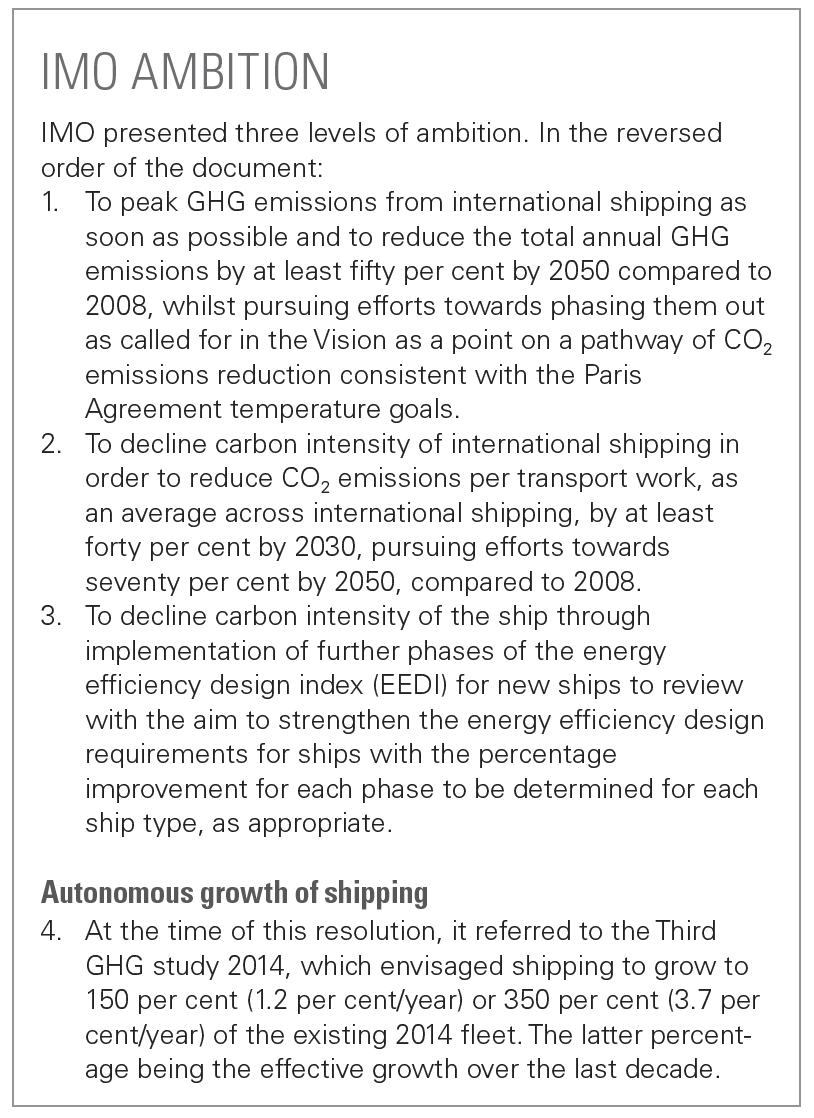
In this short review, we estimate what either of the International Maritime Organization (IMO) ambitions (1) and (2) as presented in the box below actually mean for the ship type reduction levels as requested in the ‘appropriate percentage improvement’ (3) under the two different growth scenarios (4).

The greenhouse gas (GHG) reduction ambition (1) is an absolute reduction in 2050 to fifty per cent of all fossil based CO2 compared to 2008, independently of any fleet growth. The ‘transport work’ CO2 reduction approach (2) looks at the carbon intensity reduction of transport and doesn’t account for a possible fleet growth. It just focusses on the individual transport work efficiency emission, not on the total transport emissions.
Statement (3) now suggests, by again referring to the carbon intensity and the EEDI, to follow the forty to seventy per cent reduction ambition rather than the absolute fifty per cent reduction. Will that hit the target? Likely not.
The results below illustrate what is needed for ambition (1) in table 3/4. The container vessel CO2 reduction levels required within the two growth scenarios are taken as an example. Tables 1/2 give these yearly reduction levels. The other vessel types (tanker, bulker and other) can be downloaded: Yearly emission reductions and Fleet growth & emisssions, which also provides more explanation about the calculation. (Disclaimer: the statements within and calculation results of this file are the sole responsibility of any future user.)
 Table 1. Summary of in/output on GHG reductions for the 1.2 per cent fleet growth scenario. With 2020 emissions as % of the 2008 emissions; yearly fleet growth in %; lifespan in years (fixed); average yearly required GHG emissions reduction for new vessels; average yearly required GHG emissions reduction for existing vessels; start date introduced reductions; emission contribution in 2008 per ship type; resulting emissions in 2030; and resulting emissions in 2050.
 Table 2. Summary of in/output on GHG reductions for the 3.7 per cent fleet growth scenario.
The absolute fifty per cent reduction path (1)
An important choice is how much the existing fleet will have to contribute in comparison to the new builds in order to reach the absolute fifty per cent reduction. In both of the above scenarios (table 1/2), the newbuilds contribute more, albeit that in the high fleet growth scenario we further increased the relative share for the new builds. I further slightly differentiated the individual ship type growth percentages. The other used parameters are estimations accurate enough to identify the per ship type/ category needed average reductions.
How much will the existing fleet have to contribute compared to newbuilds?
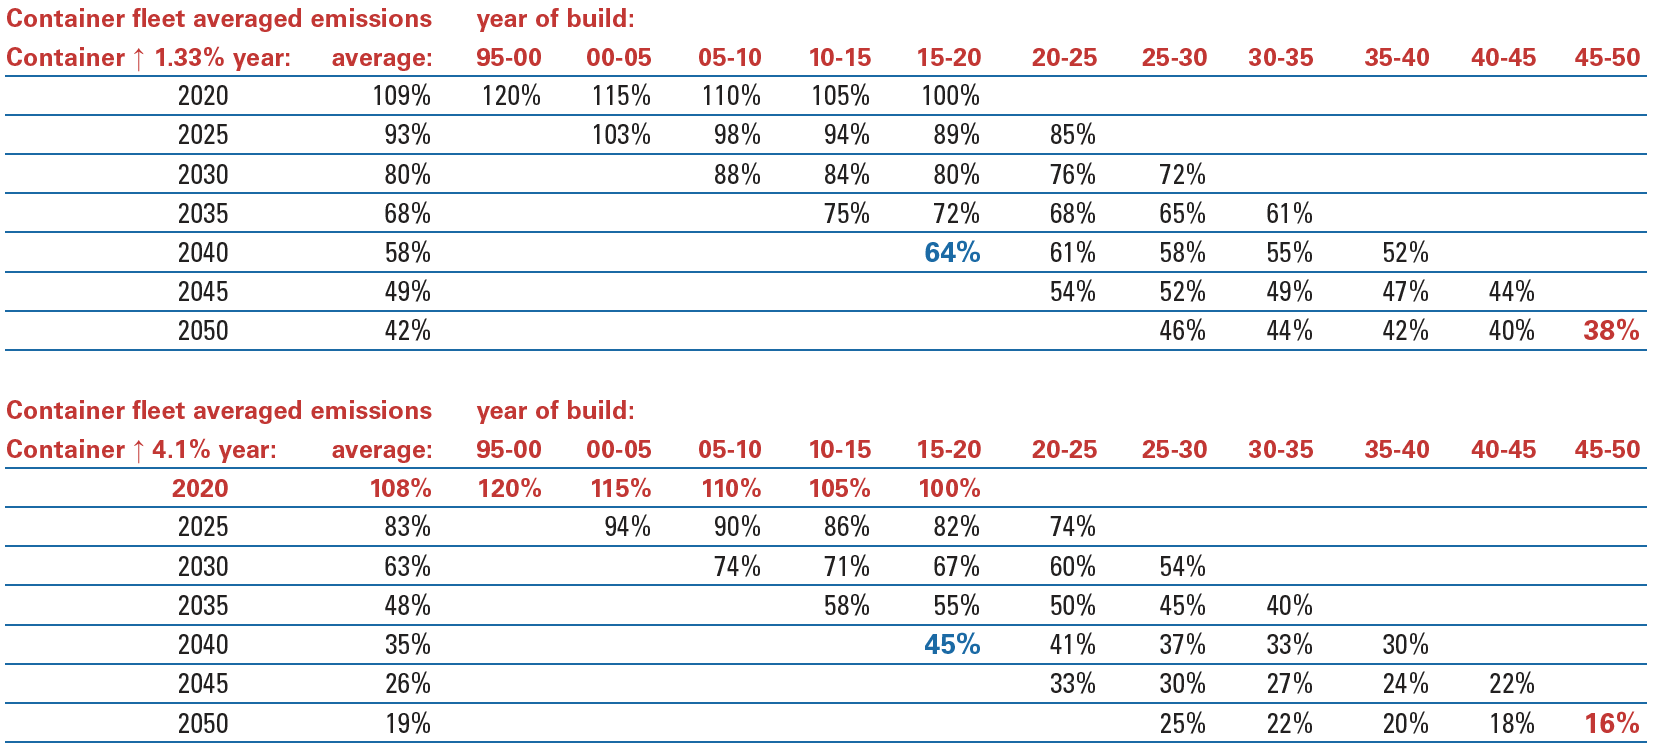
For the two fleet growth scenarios, table 3/4 shows the permitted average container vessel emissions throughout their lifetimes given their year of build. It shows that the permitted average ship emissions in 2050 finally has to reduce to 38 per cent in the low growth scenario and to only sixteen per cent in the high growth scenario. The percentages further show that even container vessels built over the last five years (15-20) have to reduce their emissions on average to 64 and 45 per cent respectively at the end of their lifetime (-2040).
 Table 3/4. The average permitted emission percentage for container vessels throughout their lifetime given the year of build.
If only new build vessels contribute to the 2050 ambition in the high growth scenario, the vessels built in 2050 are only allowed to emit on average eight per cent of fossil carbons (not shown here). The currently prepared, low ambition EEXI (EEDI for existing ships) roughly reflects this situation.
The transport work reduction path 40/70 (2)
The suggested transport work or carbon intensity reduction path as the way to reach the fifty per cent absolute reduction gives other results as they don’t account for the fleet growth. They just focus on improvements of individual ship performance averaged per class.
Table 5 shows the emissions, transport work (TW) and emissions per transport work development as a function of fleet growth taking 2008 as the reference year. The TW growth is taken from the UNCTAD review [4]. The 2030 ambition as formulated under (2) within the IMO text box is extremely weak. The table shows that these are already met for the container ships and bulkers and almost for the tanker and “other”.
 Table 5. Overview of development of emissions, transport work (TW) and emissions per TW based on the 40/70 regime. Shown emissions are based on a 1.2 per cent fleet growth.
For the 2050 ambition, as the table shows, the applied minimum growth scenario of 1.2 per cent does not meet the fifty per cent absolute GHG reduction (63 per cent). To reach the fifty per cent, a yearly fleet growth of only 0.4 per cent is allowed based upon the seventy per cent “carbon intensity” approach.
A fleet growth of 3.7 per cent leads to 130 per cent. Within this table, the Emissions 2020 are an estimation. The upcoming IMO GHG study (June 2020) will inform us about the whole period till 2020.
Conclusion
The now followed “transport work” based IMO approach (40/70) in order to reach the absolute fifty per cent reduction in 2050, is not effective in the high fleet growth scenario. This approach covers only a maximum 0.4 per cent growth of the world fleet, any higher growth overruns the absolute fifty per cent ambition.
The contribution of the existing fleet is essential both to avoid a too soon requirement for (not yet existing) renewable fuels and to enable a larger growth of the fleet. A focus on more effective operations and energy management seems the way ahead.
A focus on more effective operations and energy management seems the way ahead.
Postface
In the above information and tables, reference is made to the average required GHG emission reduction per ship, as if we were able to gradually reduce the emissions per ship. But that is not as it will work out in practice.
In practice, existing ships, including those now being built or on order, will try to get their emissions down to the lowest possible level and from that level, for most ships, the emissions will be about constant until the ship will be scrapped. Even when operational sailing speeds are further brought down, these ships will continue to emit considerable quantities of GHG emissions whilst the effect is partly undone by the additional ships required to maintain transport capacity.
Most of the reduction must come from new ships using fuel producing less GHG emissions or from ships being converted to such fuels. It is often claimed by shipping experts that as of 2030, ships should be built that are fossil fuel free. Certainly, with an expected fleet growth of 3.7 per cent that would be necessary.
Although a lot of effort is put in developing such fuels and systems, it is not very likely that we will be able to reach that goal. However, by 2040 we may be much closer to that situation which, in principle, may well allow shipping to reach the 2050 absolute GHG emissions reduction target.
The burden should be borne by all players. No exceptions for fleets or flags.
As we have seen in the above figures, a more modest fleet growth would considerably improve our chances. Two other factors will be important. One being the development of the price of fossil fuels; a high oil price would make it easier to change to other fuels. And the other factor being the capability of the international maritime world to ascertain a level playing field for all shipping fleets and nationalities. The burden should be borne by all players. No exceptions for fleets or flags.
References
- The IMO 3rd GHG study 2014, IMO 2015
- Greenhouse gas emissions from global shipping, 2013–2015, ICCT 2017
- Second IMO GHG Study 2009
- Review of maritime transport 2019

This article was published in SWZ|Maritime’s March issue as part of the special on fuels and engines. It was written by Ir Johan de Jong (left) and Ir Ad de Jong. Johan de Jong is Manager International Relations at MARIN and one of SWZ|Maritime’s editors. Ad de Jong is a systems and control engineer.
Picture (top) by Roberto Venturini.


